So your business is doing well. Your website receives traffic, and activity occurs on its pages. Though, nothing is storing this valuable information which can be used to make data-driven decisions. There is a lack of insight generation. To reverse this untapped potential, you decide to employ Google’s free Analytics application that is housed within their Marketing Platform. This product provides an array of features to help analyze your site’s data with the goal of generating insights on behaviors, trends, and associations useful for improving your online presence and future business. The time has now come to set the service up and dig into its features.
Setting It Up
To start, make sure you have a personal Google account and head to https://marketingplatform.google.com/about/analytics/. From there, click “Start for free,” and then “website.” The next entry asks you to create an account name, which will serve as the Google Analytics account associated with your personal one. Then, enter your website name, url, industry category, and time zone. Your industry category does not impact tracking or data collection but rather enables Google to create customizable reports that suit your industry-specific needs. Once completed, you will receive a tracking ID unique to the site that was just set up. In order to enable tracking, some web hosts or website builders like Wix provide features or plugins that allow you to input the tracking ID right into a field. If this is not an option in your case, you can enter this tracking ID into a specific section of a tracking snippet, and then paste that snippet into the code of each of your site’s pages that you want to track. Though tracking snippets can come in different forms to account for functionality, basic tracking snippets work fine for most purposes to start. If you want more information on this, Google’s tutorial pages provide details regarding additional snippet specifications. In general, it is a good idea to browse the various resources Google provides for powering up your website with their analytics.
Overview
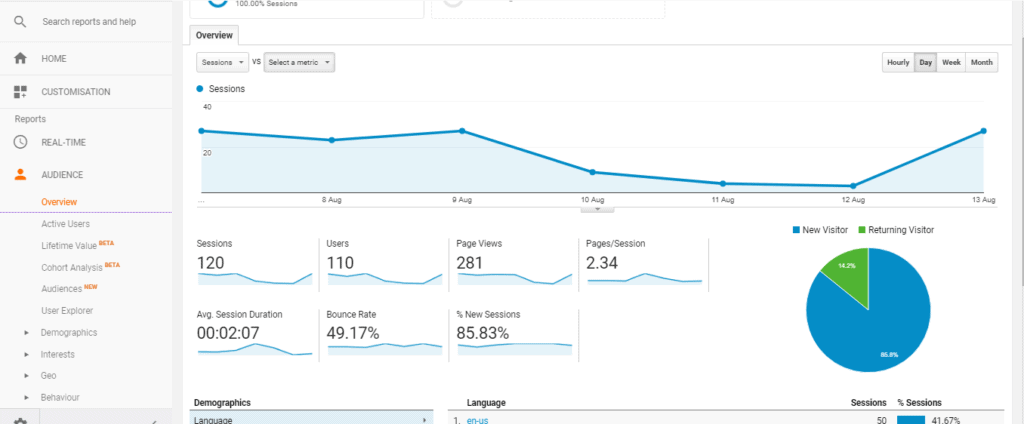
Once within the Google Analytics interface, you will see an audience overview dashboard that reports different types of data such as sessions, users, and pageviews, among several others. Scrolling down will pull up demographic splits like language and country. The information displayed in this view comes from the combination of all pages on your site. You can refine the insights displayed on this overview page by date range as well as audience segments. Lastly, a menu resting on the left of the screen provides ease of navigation throughout a majority of Google Analytics’ capabilities.
Segments
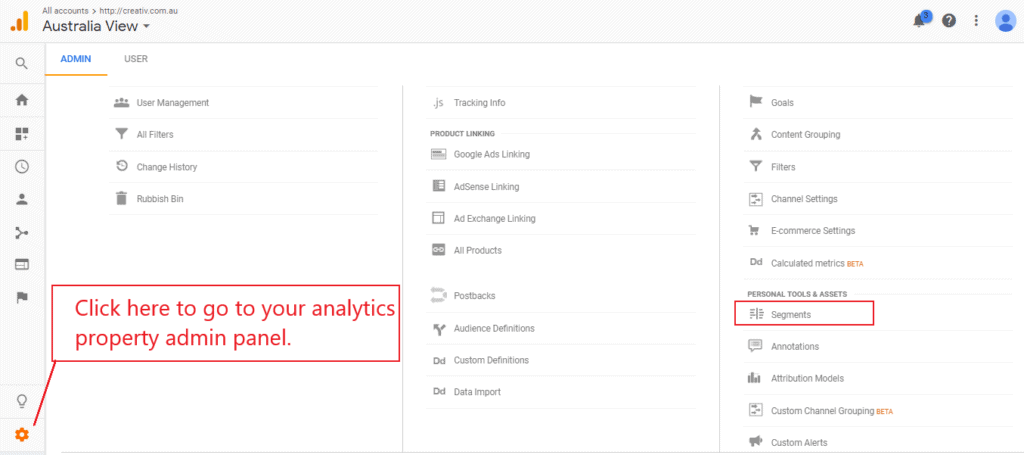
Segmenting the audience will isolate a subset of traffic to be juxtaposed against overall site traffic or other segments you wish to analyze. To define (create) a segment, you must set specific conditions related to user, session, or hit data. If the correct combination of those aspects fulfill their conditions, the associated data point enters the segment. Sessions and hits differ in that hits are specific user interactions (click, pageview, transaction, etc) on your site that occur during a session, whereas sessions are the group of hits occurring in a certain time frame or before a defined ending activity.
For your analysis, you might create a segment of users in the United Kingdom who spend at least 2 minutes on your home page — in order to separate them from the rest of your data in reports and dashboards. You can also combine conditions using “or” or “and” operators in order to produce more specific segmentations.
Essentially, segments allow for breaking traffic into more nuanced groups that could be of particular interest. The tool might also highlight important details or lucrative adjustments regarding your site, content, or product, as revealed through the groups targeted with the segment.
Goal Setting and Alerts
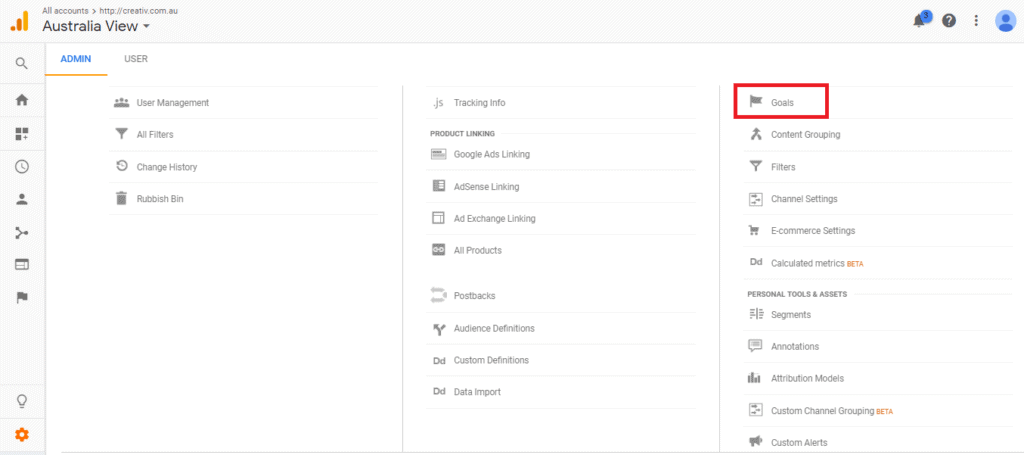
Google Analytics lets you define goals — specific on-site activities that you tell the platform to view as a conversion. You may, for example, set a goal that checks if users visit five pages in a session. Every user that visits five or more pages will subsequently be entered as a conversion for that goal. Creating your own definitions for conversions empowers generation of custom ratios and statistics to gauge occurrences on your site.
Site owners commonly utilize goals for monitoring key performance indicators such as purchases, submitting contact information, signing up for a service, or viewing a certain piece of content. Indicators of performance vary across businesses and sites. For example, a commerce entity may value and track purchases, while a marketing one might define performance by the number of email signups. When setting goals for your objective, make sure to contemplate what signifies success, or conversion, in addition to what might provide clues on the broader spectrum of behaviors that make up the critical sales funnel. People might not be purchasing your product today, but they could have viewed it three times, indicating high likelihood of future purchase. Some may decide to set both of those activities as goals. Lastly, alerts function just like goals, but instead of logging conversion, they simply notify you (via email if desired) when a set condition fulfills.
Views
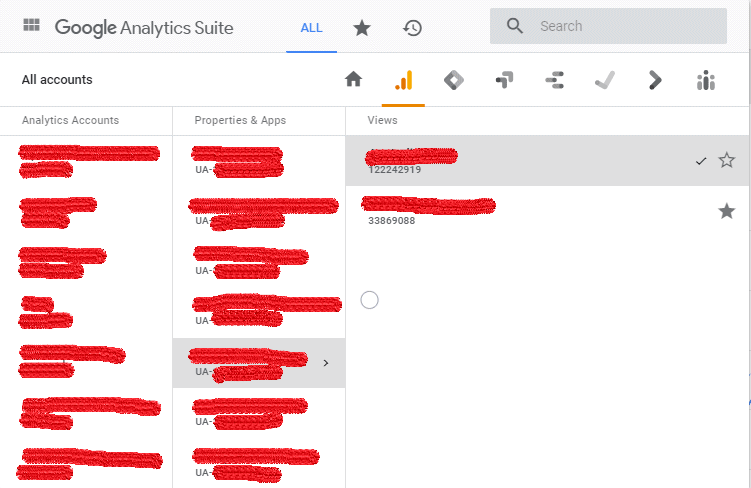
Thus far, you’ve become familiar with creating segments and goals for one particular view – the default overview – that shows combined data from all pages on your website. With this said, the analytics platform lets you add views for up to 25 subdomains per property. Each view you create houses its own segments, goals, alerts, reports, and dashboards. If you create these tools for one view, they can be copied to any other. Within each view, you can also apply filters to exclude certain data from the dashboard or to restrict viewing access for members of your organization.
Reports and Dashboards
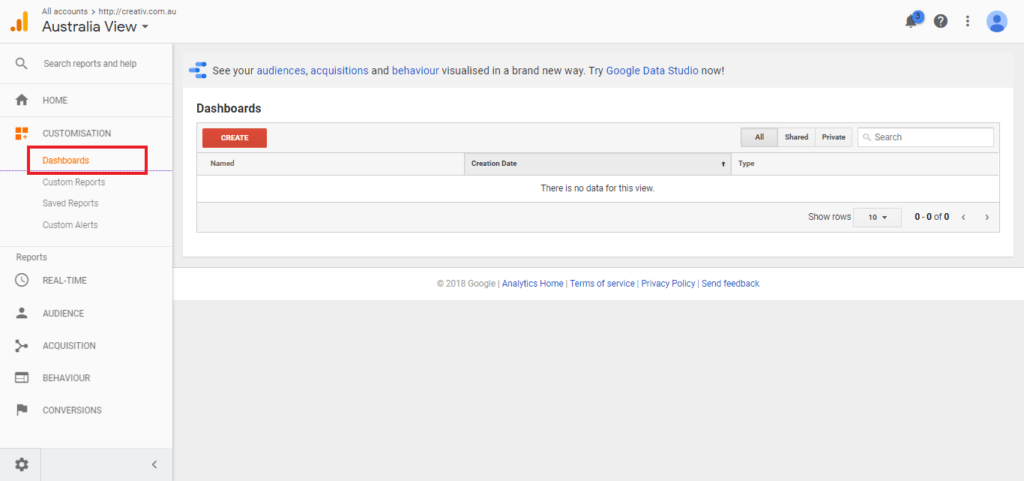
You can create reports that – well, report – on different metrics. These forms let you create custom visualizations of data that can be cut in a number of different dimensions. All created reports exist in the “reports” section of the menu, but you can place ones you so choose into each view’s dashboard. In addition to reports, dashboards can house segments and individual widgets including: Metrics, Timelines, Geomaps, Tables, Pies, and Bars.
Integration
Google Analytics provides a supports integration with tons of other services, some of which include: Campaign Manager, Google Ad Manager, Search Ads 360 Reporting, Display and Video 360 Remarketing, and Salesforce Sales Cloud. The platform’s help pages accommodate integration inquiries with rundowns for each service. A host of 3rd party solutions, perfect for integration with Google Analytics, lie on the Partner Solutions page. This page essentially functions as an app store for extensions that connect the analytics arm with existing business services. Instituting such integrations allows aspects of the business solution apps to serve as elements within dashboards or on reports. If you have data housed within a business solution app, it will also pop up in Google Analytics.
When checking out the Solutions Gallery, you will see where individuals post their custom analytics creations for all to download and use. In some cases, it may more efficient to find an existing dashboard, report, or segment than generate your own, especially if the desired creation proves to be quite complex. The Partner Solutions and the Solutions Gallery both provide descriptions of the various plugins in addition to comment sections that serve as references when perusing options.
As you may tell, Google Analytics offers quite a powerful suite full of functionality and possibilities for customization that are useful in examining your website’s data. Taking advantage of all the various features may require some familiarization. Though, thanks to the accommodative help pages provided by Google and the many online discussions, you should be able to find your way. Now, go on and generate some insights with all of that information connected to your site!
Author Bio:
Sara is an experienced tech expert who writes with her colleagues on Enlightened Digital, to share her passion with others around the web. After 15 years in the industry, her goal is to bring information on all technology to the masses. Her philosophy is to create each article so that anyone can understand the content, whether they are a consumer or a technology expert. Check out her site at Enlightened-Digital.com.
The post How to use Google Analytics: Tools to Analyze Your Website’s Data appeared first on .
from https://ift.tt/2P7NoWi
No comments:
Post a Comment